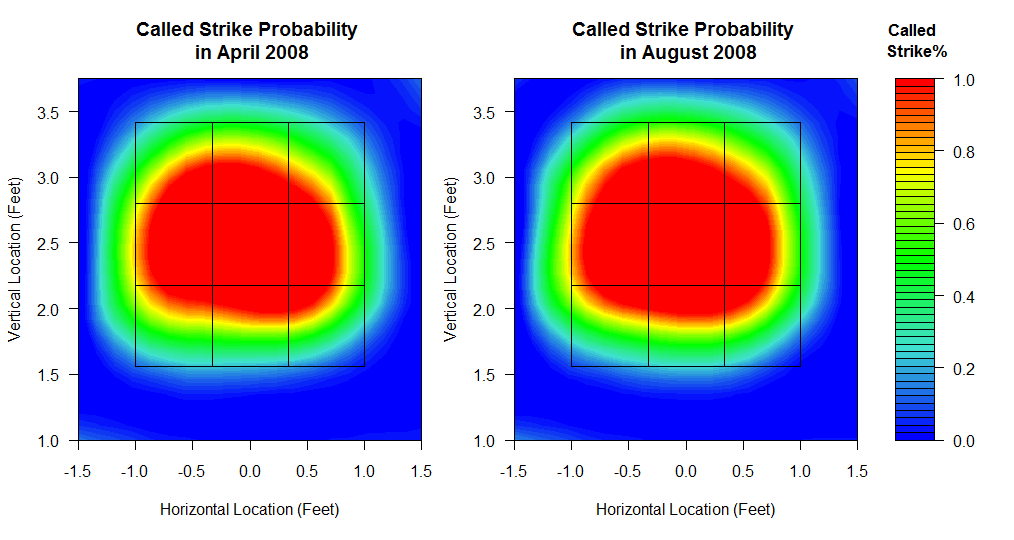
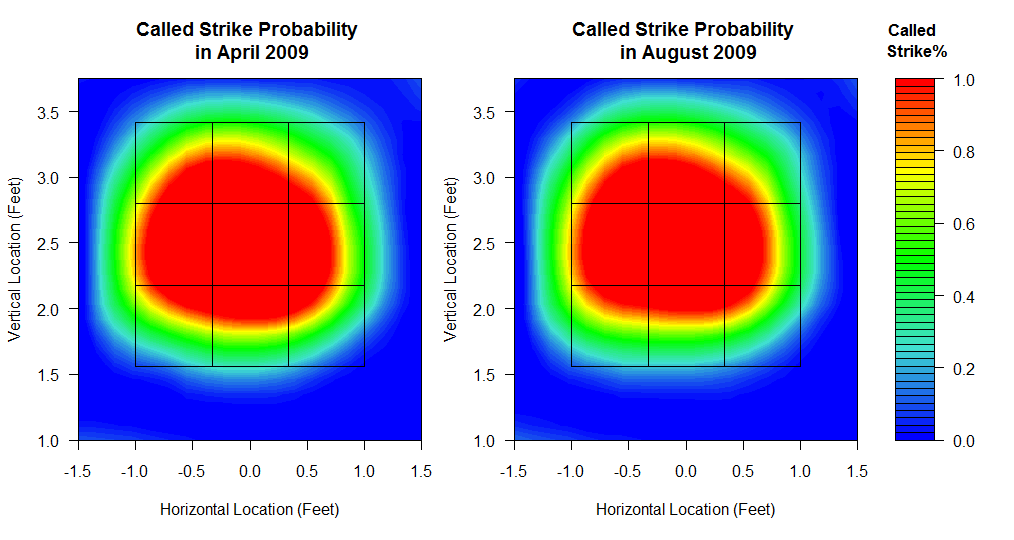
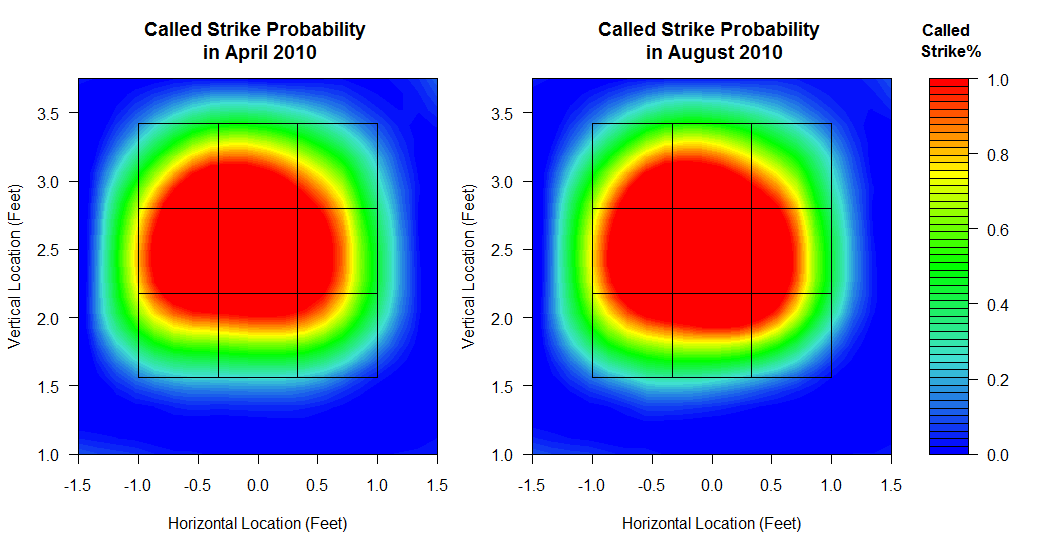
I wanted to see this for myself using my own method, so I created a called strike probability model for April 2008 vs. August 2008, April 2009 vs. August 2009, and April 2010 vs. August 2010. What I did was I pulled all called strikes and balls (ignoring all the times when the batter swings) within half a foot from the rule book strikezone, half a foot inside and half a foot outside. I then modeled a surface fit for all called strikes over pitches where the batter didn't swing. I assumed that the middle of the inner 0.5 foot border returned called strikes 100% of the time if the model did not project that far inward, and same with balls way outside the strikezone.
Let's take a look at called strikes in April 2008 vs. August 2008 to see if umpires called more strikes as the season went on in the past, where red indicates called strikes and blue indicates balls (blue balls, snicker). Note that I split the strikezone into nine equal-sized boxes for reference, while the outer border is the approximate rule book strikezone:

It looks like here that the left-right distance is not affected much, but you can see that the upper areas as well as the lower areas show more called strikes in August, if only slightly bulging. Let's take a look at April 2009 vs. August 2009:

Here, it actually looks like April had a higher probability of called strikes in the lower part of the strikezone. There isn't that much change in 2009 though compared to 2008. Now let's compare this year's April vs. the current month of August:

Is Ortiz on to something? At first, I wasn't so sure. Using the grid as reference, you can notice the red extend upwards slightly and downwards a bit more, but it didn't see like much of a difference to me. I'd have to show the numbers to back it up, as the difference in the images produced didn't seem significant enough to me. In the end, the numbers over at Zimmerman's post may well back Ortiz's claims, showing an increase in called strikes per non-swinging pitches increasing from 51.0% in April this year to 53.5% this month of August. That difference of 2.5% could very well be captured by that red dip you see in the lower third quadrants.
How much does this affect each individual batter? There were 55,240 total called strikes and balls in April. Assuming the month of August would have a similar number, that's 1381 balls converted to called strikes, 2.5% of 55,240. A quick query tells me that there were 21,191 total atbats in April, which would mean that approximately 6.5% of all at-bats in the month of August had one more called strike than in April.
Crude calculations there, but it looks like that David Ortiz might be right and that the umpires have expanded the strikezone as a whole, if only a little bit. Probably means that Ortiz had an atbat among the 6.5% of unfortunate souls who were disadvantaged by one less call in favor of the batter.
0 comments:
Post a Comment